
Explore, Compare, Visualize datasets online
Slicelytics is a browser app for exploring, comparing, and charting JSON, NDJSON/JSONL, CSV, and TOON datasets. Built for developers, data scientists, and analysts - no setup, no code, and your data never leaves your computer.
Experience the Workflow
Try our fully functional demo below to get a feel for our product.
...or watch the walkthrough
Let us walk you through the basics of Slicelytics features.
Built for Modern Data Professionals
Our aim is to provide a no-nonsense alternative for individuals and smaller teams who are serious about data quality. All our tools are fully self-service, provided at a fair flat price, with no lock-in, no demos, no sales calls...
Data Exploration
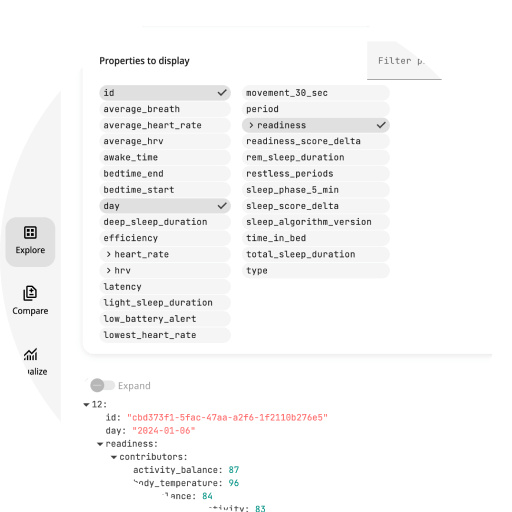
Slicelytics provides tools to understand your JSON, NDJSON/JSONL, CSV, and TOON datasets. Our powerful filtering takes you way beyond what a generic json formatter can do.
Our engine automatically infers schemas and maps data types across deeply nested structures of arbitrary depth. Filter by property name or by value (e.g. status="error"), with autocomplete for nested properties and every active filter shown as a chip you can remove in one click.
Dealing with high-volume or compressed data? We natively support Gzip and Zstandard decompression right in your browser, ensuring your workflow remains local and private.
Structural Diffing at Scale
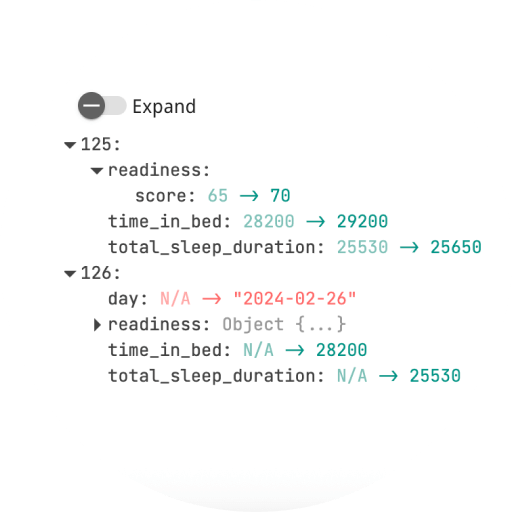
Standard diff tools fail on rich, structured data. Our comparison engine is built for hierarchy, allowing you to track changes across multiple dataset versions side-by-side.
Isolate deltas with intelligent filters that automatically adapt to your data's schema. Identify modifications in even the largest arrays and nested objects effortlessly. Both datasets can be large NDJSON files, streamed and loaded side by side, batch by batch.
See the evolution of your state: track both original and updated values for every property and array item with clear, high-contrast highlighting. Share a diff as a single link that carries both datasets.
Zero-Config Data Visualization
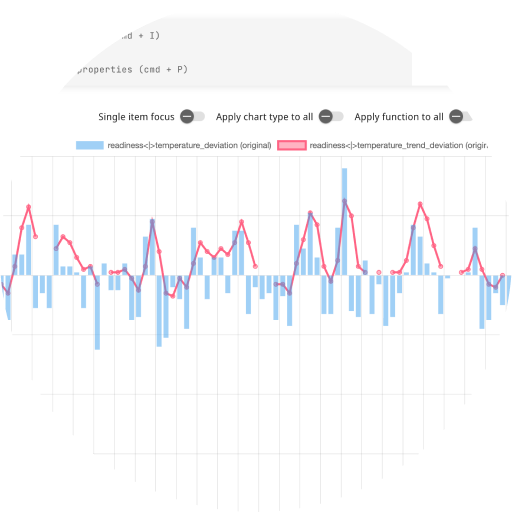
Transform tabular and nested data into compelling stories with no code required. Bridge the gap between raw logs and actionable intelligence.
Calculate critical statistical metrics—mean, median, mode, standard deviation, variance, and more—and plot them instantly. Numbers and ISO 8601 dates are both supported.
Choose from a comprehensive suite of performance-optimized visualizations: bar charts, line charts, scatter plots, histograms, bubble charts, radar maps, and beyond. Only your data sets the limit.
Open Data from AI Agents
AI coding agents such as Claude Code can open your datasets in Slicelytics for you. Ask your agent to "chart p95 latency per day from runs.csv", and Slicelytics opens with the right page, properties, filters, and chart already set up.
For small and medium datasets, your agent builds a link. The data travels in the part of the link after #, which browsers never send to a server.
For larger datasets, watch a folder: links have size limits, files in a folder don't. Your agent writes each dataset into a folder on your computer, and new files show up in Slicelytics automatically. Available in Chrome and Edge.

What's New in Slicelytics
Recent features and improvements, updated .
Fix Compare offering every property to filter
A diff opened from a link or a watched folder now offers only the properties that differ in "Properties to display" straight away, as it already did after a page reload.
Pick items in large datasets
Show or hide items by number or range (e.g. 1-5) in files of any size, even while they load.
Slicelytics plugin for Claude Code
Install the Slicelytics skill in Claude Code with /plugin install, and let Claude open your data in Slicelytics.
Large files load in the background
NDJSON files of several gigabytes load off the main thread, with a progress bar. The first items show right away.
Large datasets in Compare
Both sides of a diff can be large NDJSON files, loaded batch by batch. The compared dataset is restored on your next visit.
No freezing on large files
Every format is shown 100 items at a time, with "Load more" for the next batch.
Pricing
Join our Beta program to get free access
- checkWe'd love to hear your feedback on Slicelytics
- checkHelp us shape the data quality tools that fit your needs
- checkGet early access to experimental features
49€
What you get
- check1-year access to Slicelytics (non-renewing)
- check7-day money-back guarantee. No questions asked, simply email us at support@slicelytics.com
- checkData Quality, Comparison, and Visualization tools
- checkFully client-side processing to ensure your data stays private
- checkFrequent feature updates - see our Changelog
- checkLimited-time early-access rate
Frequently Asked Questions
Slicelytics is built for software engineers, data scientists, and analysts who need to inspect and debug structured data locally. It is a self-service utility tool for individuals and small teams.
The core features are data exploration (filtering and traversing nested structures), structural diffing (comparing hierarchical data to identify additions, modifications, and deletions), and data visualization (generating charts and calculating statistical metrics without writing code).
Slicelytics parses JSON, NDJSON/JSONL, CSV, and TOON files, plain or compressed with Gzip (.gz) or Zstandard (.zst).
Yes. It includes native Gzip and Zstandard decompression implemented in the browser. Data is decompressed client-side without being sent to an external server.
Since data processing happens entirely in the browser, performance is constrained by your local machine's memory capacity and the JavaScript engine's limits. Large NDJSON files are streamed in the background, in Explore and on both sides of Compare, with experimental support for files of several gigabytes. Files in other formats are read into memory whole, then shown 100 items at a time. Shared links are compressed, but browsers limit how long a link can be (about 2 MB in Chrome), so sharing suits small and medium datasets. Watching a folder and installing Slicelytics as an app need Chrome or Edge.
Yes, for small and medium datasets. Click the Share button in the bottom right corner to copy a link to what is on your screen: the data as filtered, plus the view (page, properties, filters, and chart settings). On Compare, the link carries both datasets. The data is compressed into the part of the link after #, which browsers never send to a server, so it is never stored by us.
Yes. Type a value filter such as status="error" in the properties filter to keep only the items where that property has that value. Filters work on nested properties too: records.type="sleep" keeps the matching items and also removes the non-matching elements from the nested records array.
Yes. An agent builds a Slicelytics link as described in slicelytics.com/llms.txt. The link opens Explore, Compare, or Visualize with your dataset and a ready-made view: which properties to show, value filters, the x-axis, and the chart type and metric. The data travels in the part of the link after #, so it is never sent to a server.
Yes, in Chrome and Edge. Click "Watch a folder" in the Explore view and pick a folder on your computer. Slicelytics lists its JSON, NDJSON, CSV, and TOON files, and new files show up in the list as they are written; click one to load it. The folder is remembered across visits.
Yes, from Chrome or Edge. Installed, Slicelytics runs in its own window. Links you open go to the window you already have open, which offers them with a "Show" button instead of replacing what you are looking at.
Available chart types include bar, line, pie, doughnut, scatter, bubble, radar, and polar area charts, plus histograms of how often each value occurs. Our Visualize tool also computes standard statistical metrics such as sum, mean, median, mode, min, max, range, standard deviation, and variance from (parts of) the loaded data. ISO 8601 dates and date-times can be charted too.