
Plot a CSV Without Uploading It
Chart a CSV, JSON, or NDJSON/JSONL file in your browser. Slicelytics reads the file on your computer, so customer data, internal metrics, and unreleased results stay where they are, even when you share the chart.
Your File Stays on Your Computer
Many online chart makers upload your file to their servers to draw it. Slicelytics reads and charts it in your browser instead. When you share a chart, the data is compressed into the part of the link after #, the fragment, which browsers never send to a server. The person you send it to sees the same chart, and our servers never see the data.
From CSV to Chart in Four Steps
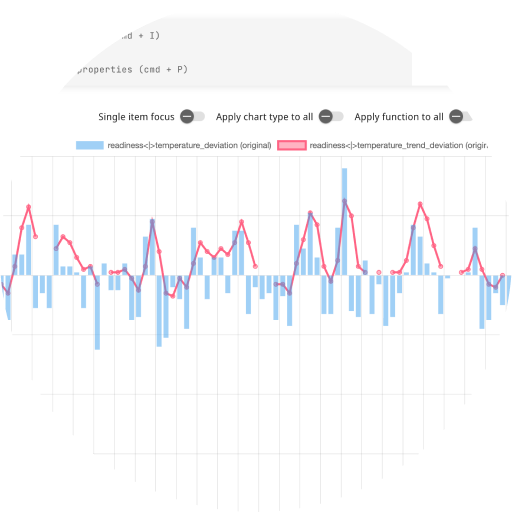
- Drop your file onto the Visualize view: CSV, JSON, NDJSON/JSONL, or TOON.
- Pick the columns to plot, e.g.
p95_msanderrors. - Set the x-axis to the column that labels each row, such as
day. ISO 8601 dates and date-times are recognised. - Choose a chart and a metric for each column: bar, line, pie, doughnut, scatter, bubble, radar, or polar area, and the sum, mean, median, mode, min, max, range, standard deviation, or variance of array values. Then export a PNG or share a link.
Let Your Agent Set Up the Chart
If an AI coding agent such as Claude Code produced the file, ask it to "plot p95 latency per day from runs.csv in Slicelytics". With the Slicelytics skill, the agent reads only the header row, leaves the file as it is, and opens Visualize with the chart already set up:
{ "v": 1, "view": "visualize", "props": ["p95_ms"], "x": "day", "chart": "line" }The link format reference lists every field the view can set.
Common Questions
Why does my line chart zigzag?
Visualize plots one point per row, in the order of the file. If the rows aren't sorted by the x-axis column, the line jumps back and forth. Sort the file by that column first.
How large can the file be?
Files you open yourself aren't sent anywhere, so there is no upload limit. A shared link carries the data in the link itself, compressed, and Chrome caps links at 2 MB, so very large datasets are better shared as files.
Can I count rows by category?
Yes. Pick the column and choose the density metric: it draws one bar per distinct value, e.g. the number of requests per endpoint.