
Compare hyperfine Runs
You benchmarked a command with hyperfine, changed the code, and ran the benchmark again. Export both runs with --export-json, and Slicelytics puts them side by side, lists every number that changed, and charts any of them. The results stay on your computer.
See What Changed
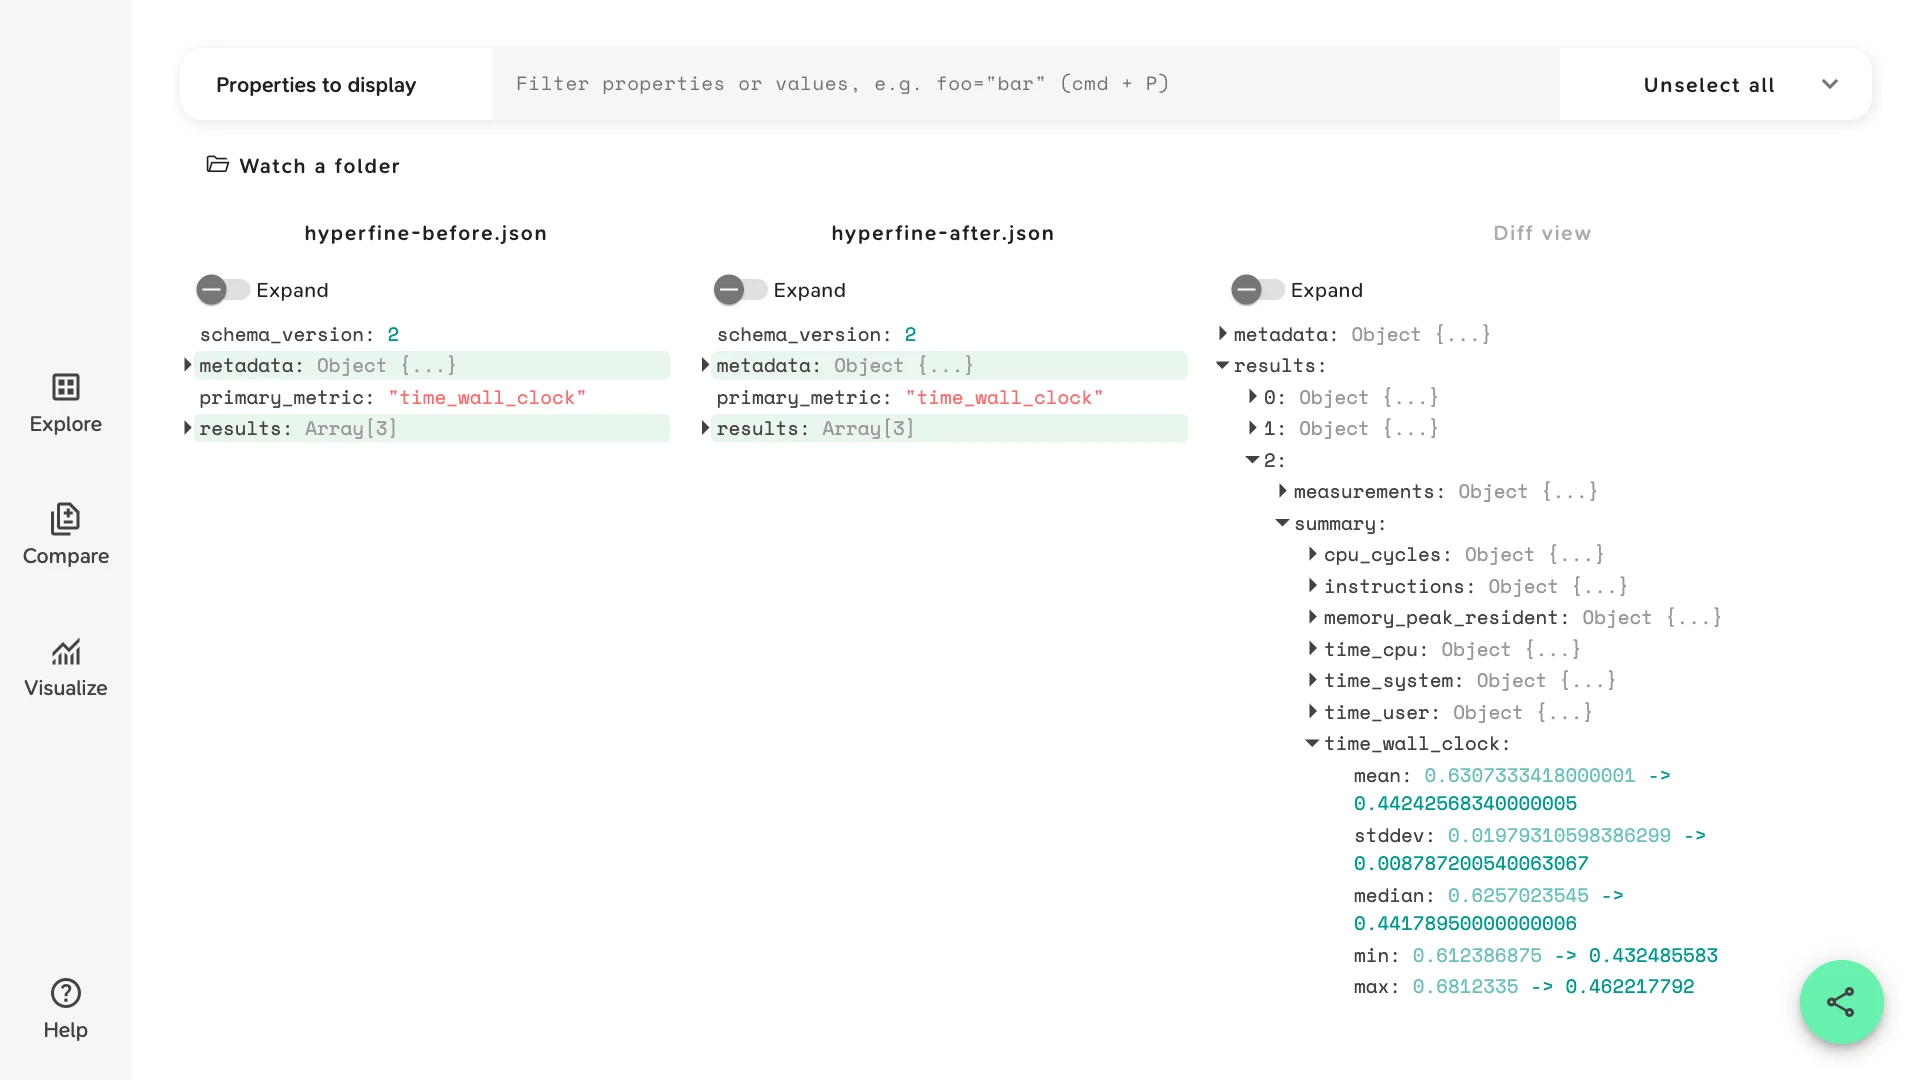
Open the two exports in Compare. Slicelytics shows them side by side, highlights what differs, and the Diff view lists only the changes, down to nested fields.
The sample benchmarks a Python script that counts word frequencies in 1, 8 and 32 MB of text, before and after one change: it reads the whole file at once and counts with collections.Counter, instead of counting line by line. In the Diff view, open results, then 2, the 32 MB file, then summary:
time_wall_clock.meanfell from 0.631 to 0.442 seconds: the new version is 30% faster.memory_peak_resident.meanrose from 17 MB to 360 MB, since the whole file is now in memory. hyperfine records memory in bytes.
The sample opens without an account. Both files are real hyperfine 2.0 exports, run on an Apple Silicon Mac: hyperfine-before.json and hyperfine-after.json.
Export Both Runs
Run the same benchmark before and after your change, and export each run as JSON:
hyperfine --warmup 2 --runs 10 -L size small,medium,large \
  'python3 wordfreq.py corpus-{size}.txt' --export-json before.json

# change the code, then run the same benchmark again
hyperfine --warmup 2 --runs 10 -L size small,medium,large \
  'python3 wordfreq.py corpus-{size}.txt' --export-json after.json
Compare matches the entries of results by their position, so keep the commands and parameter values in the same order in both runs. A command added at the start shifts every result after it, and they all show as changed.
Go Straight to the Summary
Since hyperfine 2.0, each result holds every timed run under measurements, and a summary of them under summary: the mean, standard deviation, median, minimum and maximum of the wall-clock time, CPU time, peak memory and any other metric you measured.
The individual runs always differ, so the Diff view lists all of them too. To see only the summary, open results under Filters and uncheck measurements, or open the comparison with a view that names the statistics you go by. Compare the sample's summaries, with this view:
{"v":1,"view":"compare","props":["results.summary.time_wall_clock","results.summary.memory_peak_resident"]}Chart One Run
Open a single export in Visualize to chart a metric per command, e.g. the mean wall-clock time, with the commands along the x-axis. Chart the sample's second run, or build the same chart from a link with this view:
{"v":1,"view":"visualize","props":["results.summary.time_wall_clock.mean"],"x":"results.command","chart":"bar"} With hyperfine 1.x, the mean is results.mean, and the times of the single runs are in the array results.times: chart it with the median or stdDev metric. The view format is described in the link format reference.
Let Your Agent Run and Open Both
If an AI coding agent such as Claude Code makes the change for you, ask it to "benchmark wordfreq.py with hyperfine before and after the change, and compare the runs in Slicelytics". With the Slicelytics skill, the agent builds a link that carries both exports and opens Compare with them:
python3 scripts/slicelytics_link.py before.json --compare after.json --open For an agent that tries one change after another, have it export each run into a folder that Slicelytics watches, e.g. --export-json runs/$(git rev-parse --short HEAD).json. New runs join the folder's list, newest first, and the benchmark runs guide shows how the agent names the run to compare against.
Common Questions
Does the data leave my computer?
No. Slicelytics reads the exports in your browser and uploads nothing. If you share a comparison, the data travels in the part of the link after #, which browsers never send to a server, so treat the link like the data: anyone who has it can open it.
Which hyperfine versions work?
Any version's --export-json output. hyperfine 2.0 writes "schema_version": 2 and nests each result's statistics under summary. 1.x writes them on the result itself, e.g. results.mean and results.stddev. Comparing a 1.x export with a 2.0 one shows the two layouts as different, so export both runs with the same version.
Can I compare runs from two machines?
Yes. metadata.platform shows each machine's operating system and architecture, and the Diff view lists it if they differ. Times from different hardware aren't comparable, though, so the result says more about the machines than about your change.
Can I chart a metric across many runs?
Visualize charts one file at a time. Write one row per run, e.g. run and mean, to a CSV or NDJSON file, and open it in Visualize with run as the x-axis.