
Compare k6 Load Test Results
You ran a k6 load test, changed the service, and ran the test again. Export both end-of-test summaries as JSON, and Slicelytics shows them side by side, with every metric and threshold that changed. Or chart each request from k6's JSON output. Nothing is uploaded.
See What Changed
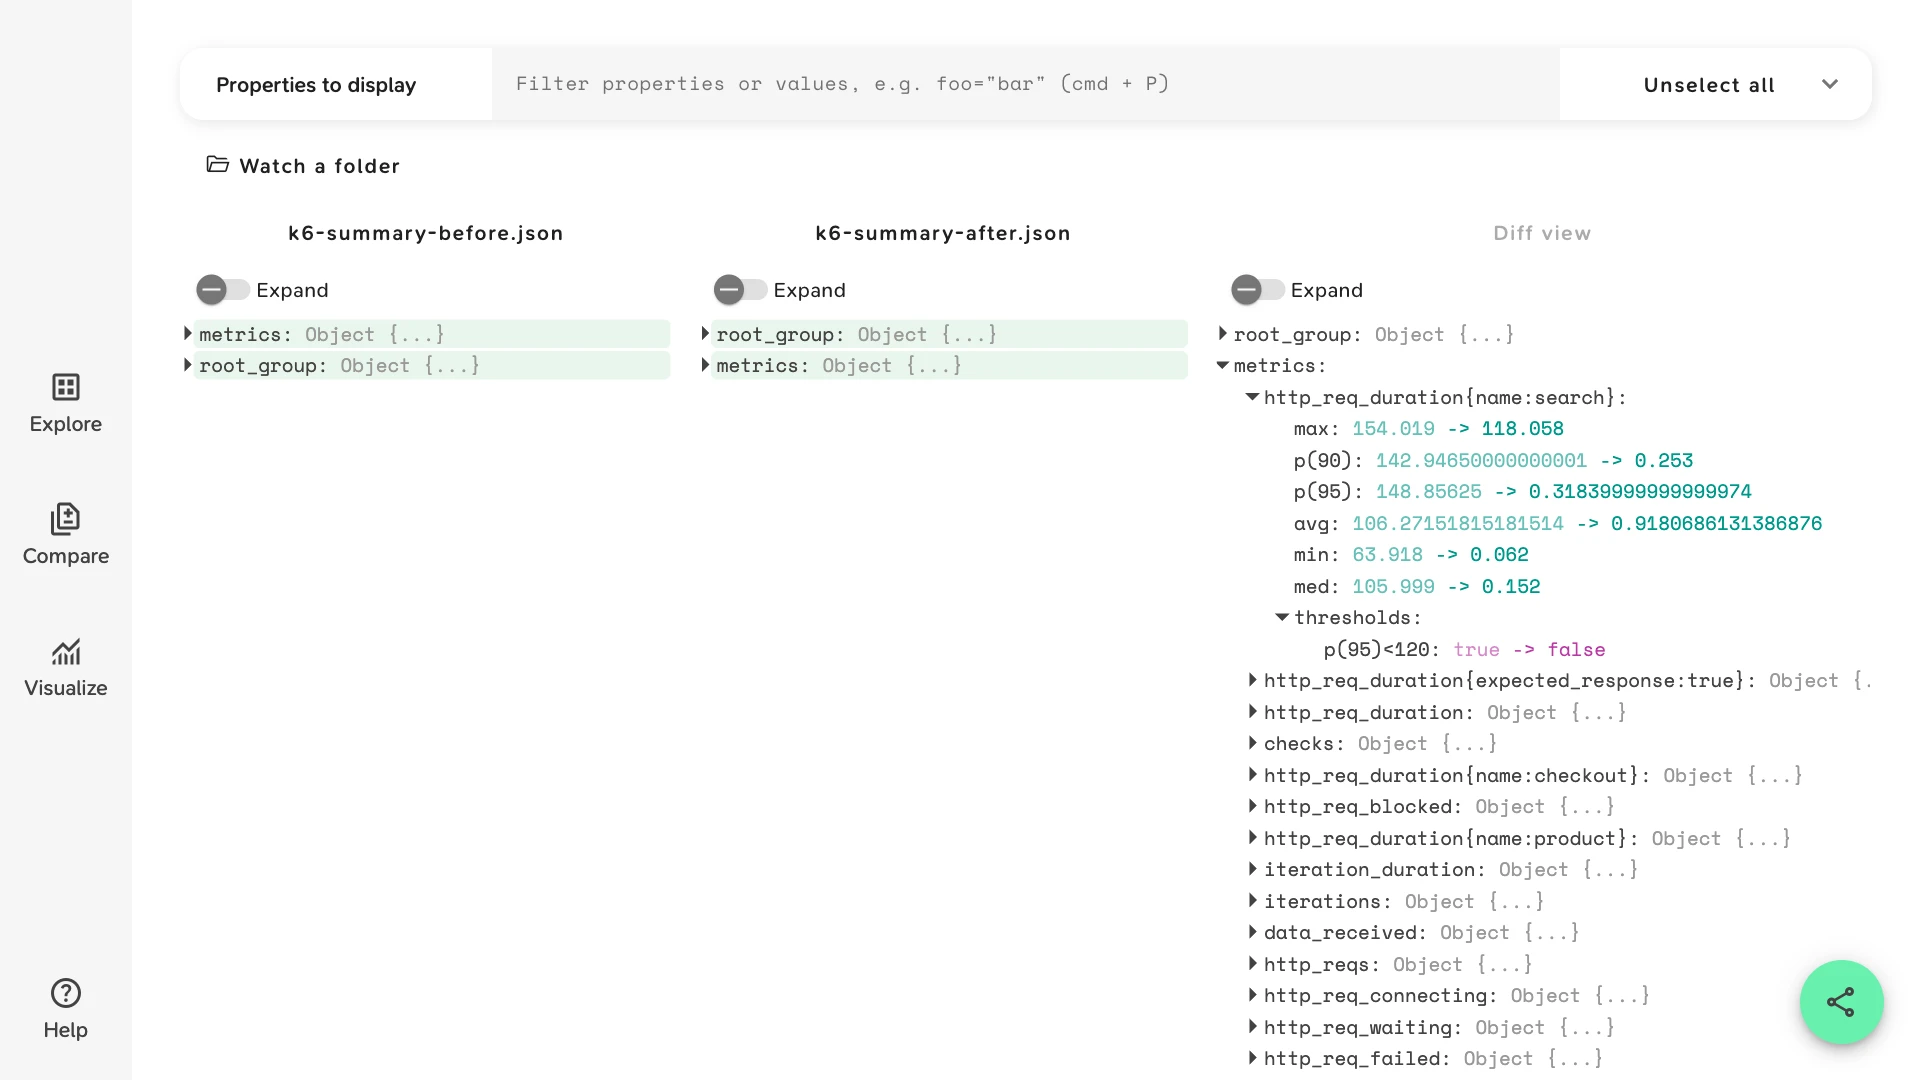
Open the two summaries in Compare. Slicelytics shows them side by side, highlights what differs, and the Diff view lists only the changes, down to single percentiles.
The sample is a k6 test of a small shop API: up to 20 virtual users, for 45 seconds, each look at a product, search, and check out. It ran twice, before and after the API started caching its GET responses. In the Diff view, open metrics:
http_req_duration{name:search}:p(95)fell from 148.9 ms to 0.32 ms, and its thresholdp(95)<120went fromtruetofalse. In the summary export,truemeans the threshold was crossed.http_req_duration{name:checkout}: the checkout POST isn't cached, so itsp(95)barely moved, from 138.0 ms to 136.6 ms. It's listed anyway: no two runs measure exactly the same.http_reqs:countrose from 1818 to 2055. With faster responses, each virtual user got through more iterations in the same 45 seconds.
The sample opens without an account. Both files are real k6 v2.3 summary exports: k6-summary-before.json and k6-summary-after.json.
Export Both Summaries
Run the same test before and after your change, and export each end-of-test summary:
k6 run --summary-export=before.json checkout-load.js

# deploy the change, then run the same test again
k6 run --summary-export=after.json checkout-load.js
The summary lists each metric under metrics, by name, so Compare matches metrics by name, whatever order k6 writes them in. root_group.checks holds your checks, with how many passed and failed.
Compare Endpoints Separately
The summary lists a sub-metric, such as http_req_duration{name:search}, only if a threshold uses it. Give each request a name tag, and each name a threshold:
export const options = {
  thresholds: {
    'http_req_duration{name:search}': ['p(95)<120'],
    'http_req_duration{name:checkout}': ['p(95)<200'],
  },
}

// in the default function
http.get(`${BASE}/api/search?q=shoes`, { tags: { name: 'search' } })
Use the same thresholds in both runs, or a sub-metric is in one summary and missing from the other, with nothing to compare it with.
Chart Every Request
The summary holds statistics only. To see how one endpoint's response times moved during the test, have k6 write every value it records:
k6 run --out json=requests.json checkout-load.js The file is NDJSON, one line per value, though its name ends in .json. Slicelytics reads it as NDJSON anyway. Open it in Visualize, and keep only the search requests' durations, in the order k6 recorded them, with this view:
{"v":1,"view":"visualize","props":["data.value"],"filters":{"metric":"http_req_duration","data.tags.name":"search"},"x":"data.time","chart":"line"}Chart the sample requests, from an 8-second run of the same test with 3 virtual users, before the cache. The file is k6-requests.json. Typing metric="http_req_duration" into the properties filter keeps the same lines by hand. Each request adds about ten lines, so long tests write large files.
Let Your Agent Open Both Summaries
If an AI coding agent such as Claude Code runs your load tests, ask it to "compare before.json and after.json in Slicelytics". With the Slicelytics skill, the agent builds a link that carries both summaries and opens Compare with them:
python3 scripts/slicelytics_link.py before.json --compare after.json --openAsk it to "chart the search requests' durations from requests.json", and it sets up a view like the one above.
Common Questions
Does the data leave my computer?
No. Slicelytics reads the files in your browser and uploads nothing. If you share a comparison, the data travels in the part of the link after #, which browsers never send to a server, so treat the link like the data: anyone who has it can open it.
Does a summary from handleSummary() work?
Yes, if your script's handleSummary writes the data it gets as JSON. Its layout differs from --summary-export: the statistics are under metrics.<name>.values, and a threshold reads { "ok": false } when it was crossed. Export both runs the same way, or they show as different throughout.
Can I chart a metric across many test runs?
Visualize charts one file at a time. Write one row per run, e.g. run and p95_ms, to a CSV or NDJSON file, and open it in Visualize with run as the x-axis.