
Compare Two Lighthouse Reports
You ran Lighthouse on a page, fixed something, and ran it again. Save both reports as JSON, and Slicelytics shows them side by side, with every score, metric and audit that changed. The reports stay on your computer.
See What Changed
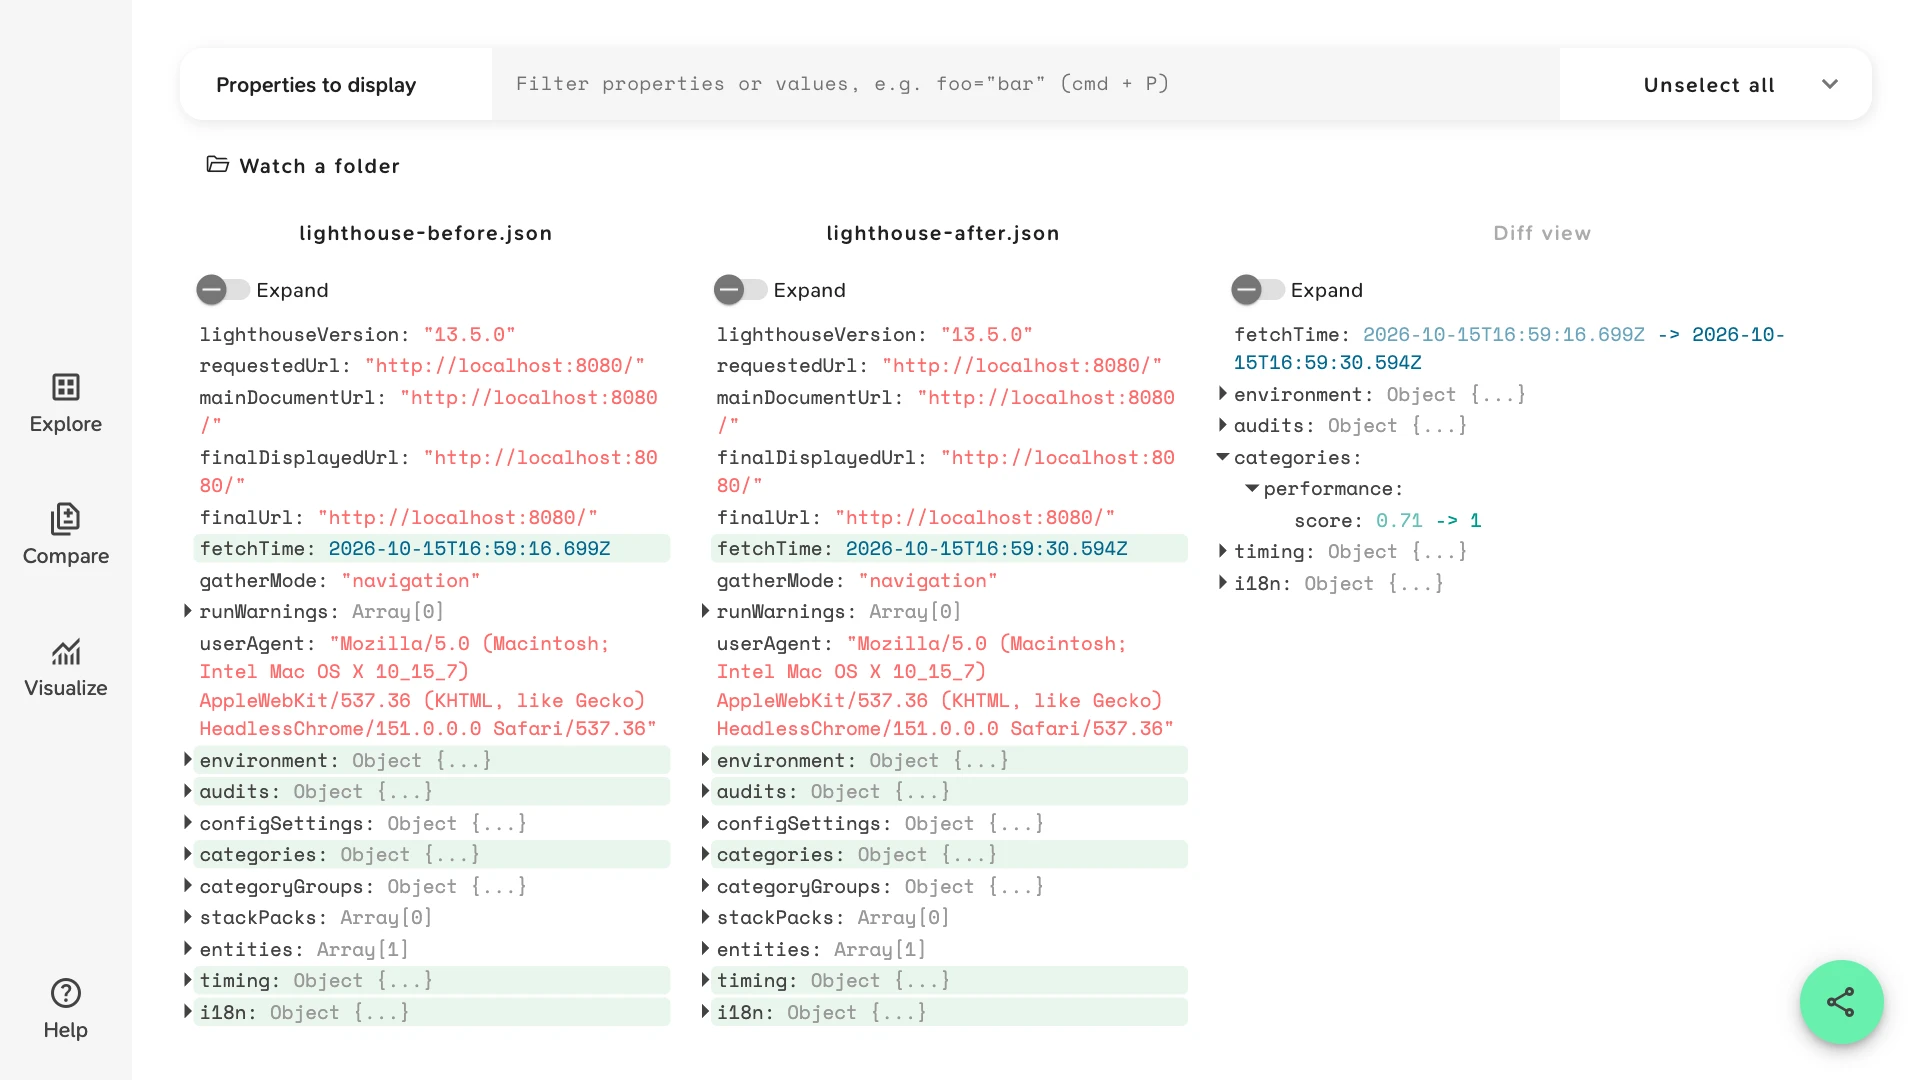
Open the two reports in Compare. Slicelytics shows them side by side, highlights what differs, and the Diff view lists only the changes, down to single audits.
The sample audits a shop's landing page before and after two fixes: its hero image went from a 9.5 MB PNG to a 131 KB JPEG with its size and fetchpriority="high" set, and the script in its <head> was trimmed and deferred. The sample opens with a view that keeps the performance score and the five metrics behind it. In the Diff view:
categories.performance.scorerose from 0.71 to 1.audits.largest-contentful-paint:displayValuefell from 47.7 s to 1.7 s.audits.total-blocking-timerose from 0 to 50 ms: the deferred script now runs after the first paint, where Lighthouse counts it as blocking.
The sample opens without an account. Both files are real Lighthouse 13.5 reports of the performance category, made with the flags below: lighthouse-before.json and lighthouse-after.json.
Save Both Reports as JSON
Run Lighthouse on the same URL before and after your fix, and save each report as JSON:
lighthouse http://localhost:8080/ --output=json --output-path=before.json

# deploy the fix, then run Lighthouse again
lighthouse http://localhost:8080/ --output=json --output-path=after.json
A report runs to hundreds of kilobytes, much of it screenshots. To keep only what you compare, as the sample does, add:
--only-categories=performance --skip-audits=screenshot-thumbnails,final-screenshot --disable-full-page-screenshotIn Chrome DevTools, the Lighthouse panel saves a report as JSON from the menu at the top of the report.
Expect Some Noise
Audits match by name, so their order doesn't matter, but every number Lighthouse measures moves a little from run to run. Unfiltered, the Diff view also lists fetchTime, how long each step took under timing, and every audit's details, e.g. its numericValue in milliseconds and its score.
To keep only what you go by, open the comparison with a view that names it, as the sample does with this one. Remove its chips under Filters to see every change. With "view": "explore", the same view shows a single report's key numbers.
{"v":1,"view":"compare","props":["categories.performance.score","audits.first-contentful-paint.displayValue","audits.largest-contentful-paint.displayValue","audits.total-blocking-time.displayValue","audits.cumulative-layout-shift.displayValue","audits.speed-index.displayValue"]} Run both reports with the same device and throttling: configSettings records them, and the Diff view lists any that differ. Lighthouse CI's lhci collect runs Lighthouse three times by default and saves each report in .lighthouseci, so you can see how much a score varies before you trust a difference. It empties that folder each time it starts, so copy any reports you want to keep.
Let Your Agent Open Both Reports
If an AI coding agent such as Claude Code makes the fix, ask it to "run Lighthouse before and after, and compare the reports in Slicelytics". With the Slicelytics skill, the agent builds a link that carries both reports and opens Compare with them:
python3 scripts/slicelytics_link.py before.json --compare after.json --openAsk it to "show only the performance score and the core metrics", and it opens the reports with a view like the one above.
Common Questions
Does the data leave my computer?
No. Slicelytics reads the reports in your browser and uploads nothing. If you share a comparison, the data travels in the part of the link after #, which browsers never send to a server, so treat the link like the data: anyone who has it can open it.
Can I keep a history of reports?
Save each report under a new name in one folder, e.g. --output-path=reports/$(date +%Y%m%d-%H%M).json, and in Chrome or Edge, click "Watch a folder" in the Explore view and pick it. Slicelytics lists the reports, newest first, and adds each new one as it's written.
Can I compare two different pages?
Yes. Compare matches audits by name, so it shows how the two pages' scores and metrics differ, e.g. a product page against your home page, or your page against a competitor's.